|
|
|||||||


 |
 |
      |
|


Mobility
Discover cutting-edge applications and technology for the mobile satellite market. Learn More
Military
Explore communications challenges and what solutions are viable for the military. Learn More
Broadcast
Experience the latest advancements in content delivery and consumption. Learn More
Maritime
Discuss the everyday challenges faced by the maritime market. Learn More
Enterprise
Explore solutions to keep your business moving forward Learn More.
|
Why Sharper Terrain Data Breaks RF PredictionsRadio communication planners have spent a decade acquiring better terrain data. Lidar surveys, commercial surface models, and photogrammetric products now reach sub-meter spacing, and the procurement case writes itself: finer input, finer output. But feeding that detail into a standard propagation model makes the coverage map worse. The effect is measurable rather than theoretical. One evaluation of elevation and land-cover inputs to ITU-R P.1812 recorded a median error of 13.7 dB at 10-meter resolution, against 2.7 dB for the same model at 100 meters. A gap that size turns a served neighborhood into a coverage hole on paper. The reason is not a defect in the model. P.1812 assumes a terrain description that is statistically representative rather than exact, and that in itself is a design choice. Which satellite data, aerial imagery, and elevation products actually suit telecommunications planning is set out on this guide from ObservationData.com. What P.1812 Actually ExpectsITU-R Recommendation P.1812 covers point-to-area terrestrial services from 30 MHz to 6 GHz, and the version in force is P.1812-8, approved September 2025. It predicts field strength along a path by combining diffraction, tropospheric scatter, and clutter effects into a single loss figure. 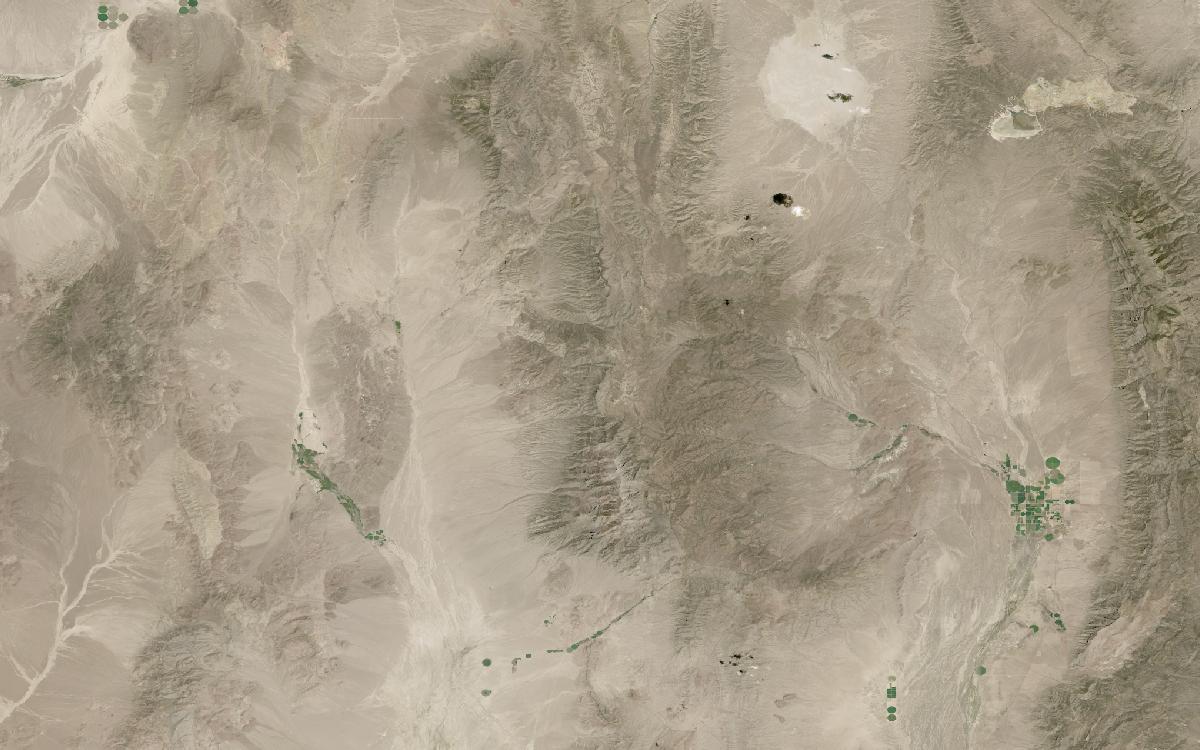
Basin and Range topography in eastern Nevada, the kind of profile a path-loss calculation has to resolve. Landsat 8/9 OLI, HLSL30 via NASA Worldview, July 29, 2026. Source: NASA/USGS. The clutter term is where the trouble starts. P.1812 treats obstructions as a statistical surface, applying representative heights for classes such as dense urban, suburban, open, and woodland. It does not attempt to trace a signal past one specific hedge or one particular garage roof. A one-meter grid supplies exactly that kind of detail. Every parked truck, boundary wall, and mature tree becomes an individual diffraction edge, and the model dutifully computes loss for each one. The arithmetic is correct while the input violates the model's assumption, and the output drifts pessimistic in a way that no calibration constant will fix. The recommendation itself prescribes no fixed grid. It states that no specific distance between profile points is given, that spacing should follow the source dataset, and that a distance increment of 30 m to 1 km is typically appropriate, with longer paths taking longer increments. Sub-meter grids sit far below the range the method contemplates. Where the Resolution Boundary SitsThe practical consequence is that terrain resolution should be chosen per planning task, not simply maximized across the board. Free global datasets cover more of these tasks than most procurement plans assume.
Copernicus DEM GLO-30 deserves particular attention here, because it lands inside the band P.1812 expects at 30-meter spacing with roughly 4 meters of global vertical accuracy, and it costs nothing. For macro-cell propagation work, a commercial product at five times the resolution is not five times better; instead, it just sits outside the design and specification envelope. When Sub-Meter Data Is the Right CallNone of this makes high-resolution elevation data a poor investment. It simply makes it a tool with a narrower purpose than vendors suggest and buyers often assume. Millimeter-wave small cells invert the argument completely. At those frequencies the link budget turns on parapet walls, rooftop plant, and individual tree branches, and a surface model at 5 to 30 meters smears all three into an averaged roofline. Planning a mmWave deployment from coarse elevation data produces optimistic predictions that fail on site, which is the mirror image of the macro-cell problem. Fixed wireless access, now a fixture in enterprise connectivity portfolios, sits in the same category. Qualifying households for service means ray-tracing sightlines against building heights, and that calculation requires structures to be resolved individually – blanket calculation based on a statistical model is bound to cause problems. The pre-qualification still has limits, because foliage density and low-emissivity glazing defeat geometric line-of-sight, so a truck roll still decides. What This Means for ProcurementThe question to settle before buying elevation data is not which product has the finest grid, but which model will consume it and at what cell size.
That last point undercuts a good deal of ad-hoc data buying. In mature markets, operators typically hold calibrated clutter layers tuned against years of drive-test measurements, and bespoke imagery rarely improves on them. The strongest case for new elevation and land-cover data is in fast-growing or under-mapped markets, where cadastral records are thin and the built environment changes faster than any refresh cycle. Coverage obligations reinforce the same discipline from the regulatory side. Ofcom, ARCEP, the Bundesnetzagentur, the CRTC, and Anatel all look to empirical measurement when coverage claims are audited, so a model alone never suffices, however fine the terrain data behind it. Modelling decides where to build, and measurement decides what counts as built. The same split holds wherever satellite and terrestrial networks are planned together, which is exactly where the telecommunications market segment sits. Resolution, in the end, is not a quality setting to be turned up. It is a parameter that has to match the model consuming it, and matching beats maximizing every time. |
|
|
SATELLITE 2014
|
 |
ATTENDEES
|
|
EXHIBITORS
|
|
MARKETS
|
|
|
||||||||

|
Copyright © 2014 Access Intelligence, LLC. All rights reserved.
|